
How risky is radon where you live?
No part of North America is radon free. Across 1.4 million U.S. radon tests from 2008 to 2017, about 1 in 3 came back at or above the EPA action level, and Canada's 2024 national survey found about 1 in 5 homes at or above Health Canada's guideline. Type your ZIP or postal code below to see what tested homes near you have found, and the one thing no map can tell you.
Before you read the map. Every color on it comes from homes that chose to test. In Canada, about 1 in 8 households has ever tested. In the United States, about 1 in 4. The map shows what the tested homes found. The far larger number is the homes that have never looked, and radon is the second leading cause of lung cancer in both countries, behind only smoking. The fix starts with one test in one home.
Nothing you type here leaves your browser.
United States: share of radon tests at or above 4 picocuries per liter (pCi/L), by county, from national radon labs, 2008 to 2017, as reported by the CDC Tracking Network; counties with fewer than 20 tests show the EPA radon zone instead. Canada: share of long-term tests at or above 200 becquerels per cubic meter (Bq/m³), by census division, from the 2024 Cross-Canada Survey of Radon; small divisions are pooled with neighbors. These are tested homes, not all homes, and people often test where radon is already suspected. ZIP codes are matched to counties and postal codes to census divisions, so a lookup is approximate.
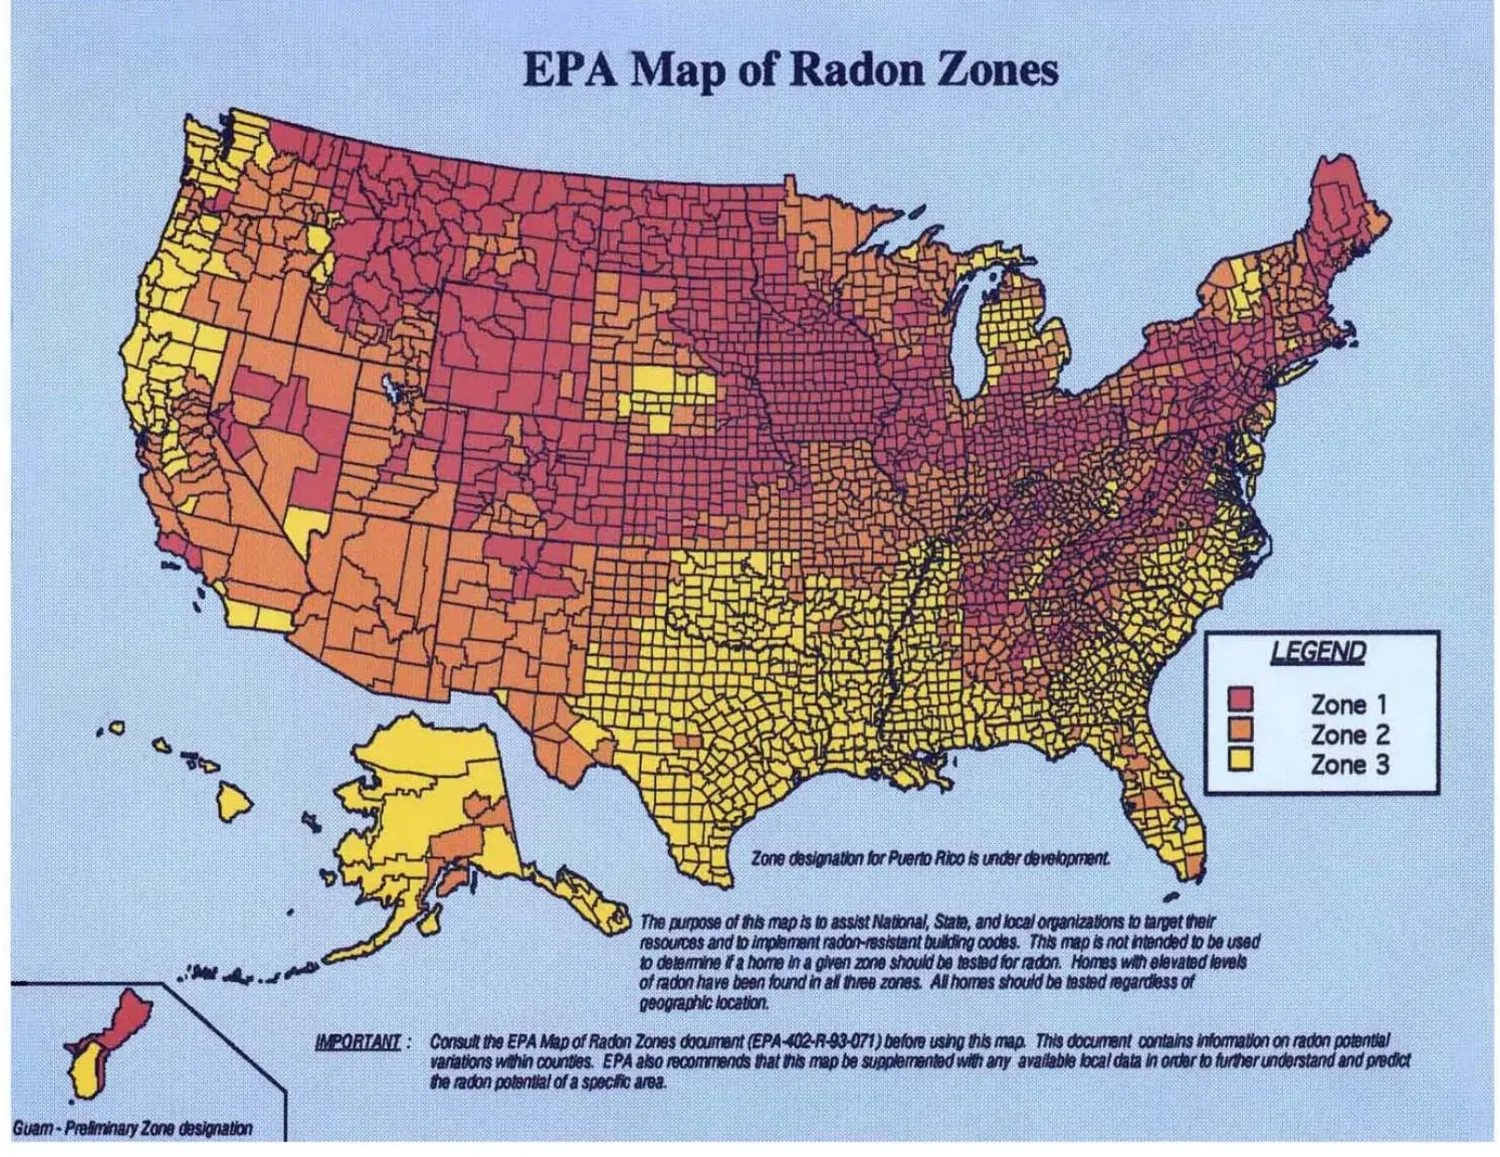
The interactive map could not load. Above: the EPA Map of Radon Zones (U.S. Environmental Protection Agency, source, public domain). Zone 1 counties have a predicted average indoor level above 4 pCi/L, Zone 2 between 2 and 4, Zone 3 below 2. In Canada, the 2024 Cross-Canada Survey of Radon found about 1 in 5 homes at or above 200 Bq/m³, with the highest shares in the Prairies, the Maritimes and the interior of British Columbia.
How to read the numbers
Three agencies, three lines in the sand. Each country's map color uses its own line.
World Health Organization reference level
The level the WHO suggests countries aim for. About 2.7 pCi/L. Canada's survey publishes how many homes sit above it, so the card shows it for Canadian areas.
U.S. EPA action level
About 148 Bq/m³. The EPA says fix your home at or above this level, and consider fixing it between 2 and 4. The U.S. map colors count tests at or above 4.
Health Canada guideline
About 5.4 pCi/L. Health Canada recommends fixing a home within two years above this level, sooner above 600. The Canadian map colors count tests at or above 200.
One unit converter line is all you need: 1 pCi/L equals 37 Bq/m³. Both countries ask for the same kind of test first: a long-term test of three months or more that spans the heating season, because radon in a home swings from day to day and season to season. A short test can tell you something is there. Only a long test tells you what you live with.
Where radon runs highest
Ranked from the same data as the map. Areas with too few tests to rank fairly are left out.
United States, by state
Share of radon tests at or above 4 pCi/L, 2008 to 2017, states with at least 1,000 tests. Source: CDC.
- North Dakota5,054 tests59%
- South Dakota4,760 tests59%
- Nebraska29,758 tests58%
- Iowa68,663 tests57%
- Ohio84,325 tests52%
- Wisconsin55,359 tests47%
- Colorado69,620 tests47%
- Montana6,612 tests46%
- Illinois85,532 tests43%
- Wyoming4,713 tests43%
Canada, by census division
Share of long-term tests at or above 200 Bq/m³, divisions with at least 100 readings. Source: 2024 Cross-Canada Survey of Radon.
- Northern Manitoba, seven divisions pooled175 readings65%
- Victoria County, New Brunswick189 readings58%
- Division No. 6, Saskatchewan818 readings46%
- Les Collines-de-l'Outaouais, Quebec175 readings44%
- Lanark County, Ontario114 readings42%
- Central Kootenay, British Columbia2,837 readings42%
- Halifax, Nova Scotia2,854 readings39%
- Lunenburg County, Nova Scotia177 readings38%
- Division No. 3, Alberta128 readings36%
- Thunder Bay, Ontario896 readings35%
Two things stand out. The highest shares sit on the Prairies and the northern Plains on both sides of the border, where glacial soils are rich in uranium. And high readings turn up in places with no reputation for radon at all: Halifax, the Ottawa Valley, the Kootenays. A low number for your area is good news about your neighbors' homes. It is not a result for yours.
A map can't see your house
Every agency behind this data says the same thing: these are averages, not answers.
Areas are averages
A county or census division is a wide net. The number describes the homes that tested there, not your street and not your foundation.
Neighbors differ wildly
Two homes side by side can test completely differently. Soil, cracks, drains, and how the house breathes decide the number, not the postal code.
Only your own test counts
The EPA and Health Canada both say it plainly: every home should be tested, whatever the map shows. Low areas have high homes, and high areas have low ones.
Sources and methods
Government and university data only. Nothing on this map is modeled or estimated by WellNest. We draw the published numbers and credit the people who measured them.
- U.S. measured results: CDC National Environmental Public Health Tracking Network, Radon Tests from Labs, share of pre-mitigation tests at or above 4 pCi/L by county, 2008 to 2017 window, accessed October 2026 (source). Counts are tests performed, not a random sample of homes.
- U.S. zones: U.S. Environmental Protection Agency, Map of Radon Zones, 1993, county table republished June 2024 (source). Public domain. Shown with a hatch where a county has fewer than 20 tests.
- U.S. boundaries and ZIP codes: U.S. Census Bureau, Cartographic Boundary Files 2021 and the 2020 ZCTA to County Relationship File (source). Public domain. A ZIP code is matched to the county holding most of its land area.
- Canada measured results: Cross-Canada Survey of Radon working group, a collaboration between the Evict Radon National Study, the BC Centre for Disease Control and Health Canada. Cross-Canada Survey of Radon Exposure in the Residential Buildings of Urban and Rural Communities, 2024, Version 1.1, census division tables (www.crosscanadaradon.ca). Figures are shown as published; where the survey pooled neighboring divisions, every division in the pool shows the pooled figure.
- Canada boundaries and postal codes: Adapted from Statistics Canada, 2021 Census Boundary Files (census divisions and forward sortation areas), 2021. This does not constitute an endorsement by Statistics Canada of this product. Contains information licensed under the Open Government Licence – Canada. A postal code is matched through its first three characters to the census division holding most of that area.
- How many homes have tested: Canada, Statistics Canada, Households and the Environment Survey 2023, about 12% of households outside apartments have ever tested (source). United States, a 2024 national poll by the U.S. EPA and Ohio State University in which three in four Americans said their home had never been tested (source). Lung cancer figures: about 21,000 U.S. deaths a year (EPA) and about 3,000 in Canada (Health Canada).
- Guidelines: Health Canada (200 Bq/m³), U.S. EPA (4 pCi/L) and the World Health Organization (100 Bq/m³).
- Method: boundaries are simplified for the screen and drawn in one equal-area projection. Color tiers are WellNest's: under 10%, 10 to 20%, 20 to 35%, 35 to 50%, and 50% and up of tested homes at or above the national action level. Map and page design © WellNest. Data last refreshed October 2026.
Radon is 1 of 9 invisible risks
The free Guide shows you all nine, what each one does, and where it hides in your home. Start there, then test the one room where radon collects first.
Get the Free GuideWant the whole-house picture? Take the Home Wellness Audit